


Packing Metrics
Know how every line is running, right now.
Sensors on your lines feed a live dashboard for the packing floor. Real-world data, turned into numbers you can act on: what's running, what's paused and what's behind.
Real-world data. Actionable metrics.
Sensors count what actually comes off each line, so the numbers are real, not typed in at the end of a shift. Each line gets one score (OEE, overall equipment effectiveness) that combines how often it runs, how fast it runs, and how much good product comes off it. Green is good, red needs a look.
Line by line, minute by minute
- Expected vs. actual. Boxes per minute against what the line should do.
- Running or paused. A timeline of the whole day, so stoppages jump out.
- What's on the line now. Product, how many done out of the order, pallet type, time elapsed and who's running it.
Find out where the time and money go
Shifts
Shift 1 vs. Shift 2
Compare every shift on every line. If Shift 2 runs slower on Line 3, you'll see it the next morning.
Packaging
Top packaging waste
Which bags and boxes are being wasted, by item, so you can fix the cause and order less.
Equipment
What's causing downtime
The machines that stop the line most often, ready for your maintenance list.
No extra typing
The dashboard fills itself from sensors, your equipment and the rest of PATH. Nobody keeps a separate tally.
- Sensors on the line count product and catch stoppages the moment they happen.
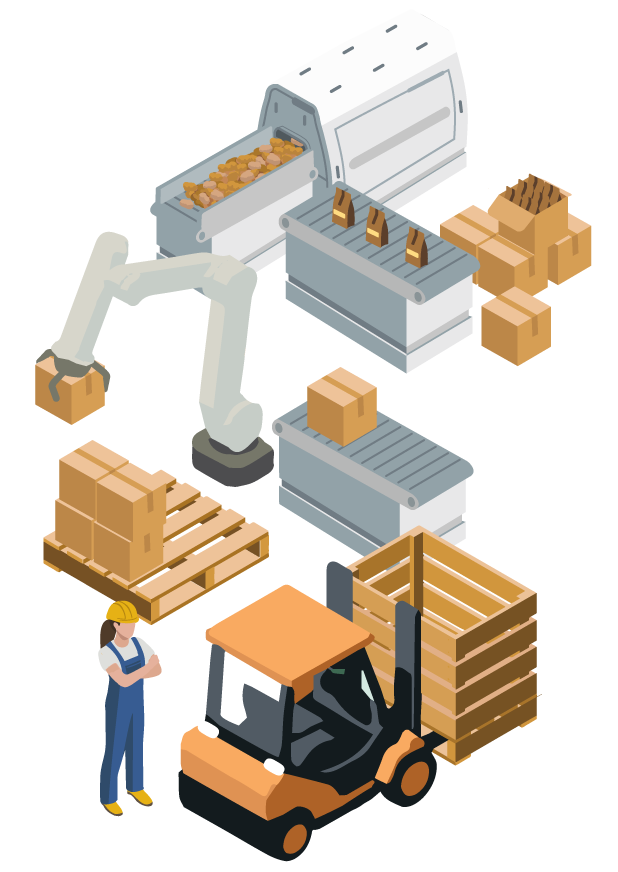
- Your machines report in directly: robotic palletizers, label printers and barcode scanners.
- Packing schedules set what each line should run.
- Packaging tracks bags and boxes used and wasted.
- Maintenance picks up the machines causing downtime.